Data shows the transaction fee on XRP has seen a severe decline since February 2025, a sign that demand for using the chain has waned.
XRP Total Transaction Fees Has Plummeted
In a new post on X, on-chain analytics firm Glassnode has talked about the latest trend in the Total Transaction Fees for the XRP blockchain. This metric tracks, as its name suggests, the total amount of fees that senders are paying to the network for processing their transfers.
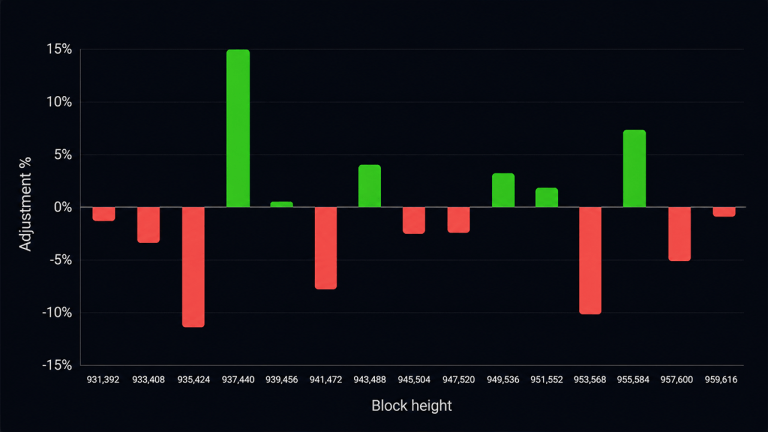
Below is the chart shared by Glassnode that shows how the 90-day simple moving average (SMA) of the XRP Total Transaction Fees has fluctuated over the last few years.

As is visible in the graph, the XRP Total Transaction Fees shot up to a relatively high level back in late 2024-early 2025, indicating that demand for using the network had shot up as the cryptocurrency’s price had rallied. Interestingly, while the asset again went on to surge in the second half of 2025, the 90-day SMA value of the metric saw no increase. In fact, its value actually contracted despite the rally.
From the chart, it’s visible that a particularly strong downtrend took hold in the last few months of the year, with the Total Transaction Fees hitting a low in December. 2026 so far has seen some stability, but the indicator’s value has still overall gone down.
Today, the 90-day SMA Total Transaction Fees are sitting at about 500 XRP, which is 91.5% down compared to the 5,900 XRP peak observed in February of last year. “A drop of this magnitude is not a fee market adjustment,” noted the analytics firm. “It reflects a near-total contraction in organic transaction demand on the network since the speculative peak.”
XRP isn’t the only cryptocurrency network that has seen a decline in transaction activity. As Capriole Investments founder Charles Edwards has highlighted in an X post, the Annual Fees on the Bitcoin blockchain have dropped to the lowest level since 2019.

The Annual Fees indicator here represents the entire Bitcoin miner revenue, so its trend doesn’t only depend on the transaction fees. However, as displayed in the chart, this metric went down even as BTC rallied to its all-time high in 2025.
This is significant because the other component of miner revenue, the block subsidy, is mostly dependent on the asset’s USD price (outside of Halving events). Thus, the Annual Fees going down even as the price rallied suggests that a decline in the transaction fees was occurring even as the block subsidy rose, thus inducing a continued downward trajectory in the metric.
BTC Price
Bitcoin briefly recovered above $64,000 on Monday, but the coin has since pulled back as its price is back at $60,900.

You can get bonuses upto $100 FREE BONUS when you:
💰 Install these recommended apps:
💲 SocialGood - 100% Crypto Back on Everyday Shopping
💲 xPortal - The DeFi For The Next Billion
💲 CryptoTab Browser - Lightweight, fast, and ready to mine!
💰 Register on these recommended exchanges:
🟡 Binance🟡 Bitfinex🟡 Bitmart🟡 Bittrex🟡 Bitget
🟡 CoinEx🟡 Crypto.com🟡 Gate.io🟡 Huobi🟡 Kucoin.


Comments